What does it mean “to know by heart”?

There’s an intriguing recent study showing that people’s sense of whether faces are familiar to them or not is affected by physiological signals from the heart. The experimental subjects were wired up to a heart monitor and during the facial memory test, some of the faces were presented at the precise moment that the heart had just pumped a burst of blood into the arteries (systole phase), while the other faces were presented while the heart was relaxing (diastole phase). Subjects were more likely to say that they had seen the faces before (whether they had or not) if the faces were presented during the systole rather than the diastole phase. Read more about the study here.

Yet another thought provoking example of how bodies inform minds.

Posted in Psychology, Uncategorized | Tagged , , , , | Leave a comment

Maybe we’re the ‘weird lunatics’ not them

Challenging article by Slavoj Zizek in the New Statesman about why we, as Europeans, feel so threatened by the migrant refugee crisis. We feel threatened by the strangeness of the other instead of seeing the strangeness in ourselves through other eyes. As he says: … “We should learn to experience ourselves as eccentric, to see our customs in all their weirdness and arbitrariness.”

Posted in Uncategorized | Tagged , | Leave a comment

Talk to the humans….

If you are an academic and/or a scientist, read this recent lecture by Daniel Gilbert. It’s worth it.

Ouch.

Click to access SPSP2016.pdf

Posted in Uncategorized | Leave a comment

Domestic Energy Storage

We are thinking of buying a domestic storage battery to better exploit our PV panels.  They already generate more electricity than we use over the course of a year (see graph below), but that doesn’t mean we have sustainable electricity supply.  As everyone – except for its more rabid proponents – realises, renewable electricity cannot satisfy peak demand reliably, and, because we therefore need other more constant sources of power, it is often wasted during demand troughs.

Corlan PV 2011A battery would at least ensure that for a lot of the summer our PV could provide all our electricity and reduce peak demand on the grid.  For much of the winter, of course, it won’t, though if our domestic battery also re-charges itself overnight in the winter, when demand is low, that can at least reduce peak demand.  This makes better use of renewable capacity elsewhere, so is worth doing if we can afford it.

At present, the financial incentive to install a home battery is marginal for most people, although that will change as batteries become cheaper.  If we just used our battery to shift our entire grid demand to night time Economy 7 electricity, our bill would come down from £334 to £222 a year, simply because we would be paying for all our electricity at night time rates.  Being able to transfer any summer daytime surplus PV for evening use will reduce our bill, and our peak grid demand, even further.

Despite the fact that we generate more electricity over the course of a year than we use, we can’t achieve grid independence with a battery only able to hold a day or two’s demand.  A battery big enough to carry our summer surplus over to the winter would probably require planning permission, which is difficult for residents of a National Park.  Plus it would offer fairly poor return on the huge capital outlay.

But I am persuaded that transition to totally renewable electricity generation is going to require fairly substantial storage to make full use of intermittent generation.  Some of this will probably need to be done at the supply end – for example by schemes like the Dinorwig pumped storage scheme, or adding storage to solar and wind farms.  Those might require some incentive to attract the necessary investment.  But storage can play a useful role at the demand end – batteries in domestic and commercial premises can effectively smooth the spiky grid demand curve and smart metering and dynamic tariffs can encourage charging strategies that take maximum advantage of renewable energy gluts.  Here are some further thoughts on the topic.

Posted in Technology | Tagged , , | Leave a comment

Growth and Waist

UK grocery sales in decline for first time in 20 years.

… was the shocking headline in the Guardian in November 2014.  At a time of very low inflation, UK shoppers failed to buy more from supermarkets than they had the previous year for the first time since 1994.  This is taken as evidence of something being seriously wrong with the supermarket business, a fact emphasised by the much publicised difficulties that Tesco – the UK market leader with still over 30% share of the groceries market.

The blame for this alarming state of affairs was put at the door of the so-called “discounters” – ALDI and LIDL – who have between them taken nearly 10% of the UK market in recent years.  Discounter market share is expected to grow, despite the minor contraction in total market size, to the extent that market analysts and Tesco’s shareholders were beginning to ask serious questions.

Because “growth” is an imperative in all markets and, indeed, all free market economies.  Growth in total revenue is a given, but so also (bizarrely) is growth in market share.  It is logically impossible for all players in a particular market to grow their share, but provided the market itself grows, everyone could at least grow their revenue.  With the kind of inflation levels we now understand to be essential for free market economies (about 2%, by the sound of it) then with no change in market share, everyone could (in money terms) earn a bit more every year.  And everyone ought to be content – but obviously wouldn’t be.

For some market players to grow their share, other players must lose it.  Sustained growth in market share by some means sustained contraction in market share for others, leading eventually to the elimination of the weaker players.  And if this happens in a market that isn’t itself growing in real revenue terms, you could have the frightening situation where even the market leader is ceasing to grow revenue, as is happening to Tesco now.

So should the rest of us be worried about the difficulties being experienced by the supermarket industry, and in particular the market leader?  Leaving aside (as we must for now) the tragedies and social costs of people losing their jobs and pension funds losing income, should we be alarmed if the supermarket industry stopped growing its total revenue, with the likelihood in that event of some familiar, and perhaps even formerly dominant, players going to the wall?

Because this is, after all, the “natural” state of things in other biological and ecological systems.  All organisms come to life, grow, reproduce (if successful in that respect), decline and die.  Individual organisms have natural lifespans to which they have evolved over time.  But do companies, industries, nation states and civilisations have a natural lifespan?  And if they are not to be subject to the laws governing the lifespans of other living things, how do they manage it?

The food industry as an organism occupies an interesting spot on a spectrum that ranges from individual living things, through collectives such as businesses to cultural phenomena such as nation states and civilisations.  This is because it services an essential need of another organism, the population.  And in a steady state, the total calorie intake – the amount of food consumed – of a population should only grow in line with the population.

The UK population is currently growing at a little over 0.6% a year, a rate that peaked in the early part of the last decade at about 0.8%.  So the amount of food we eat ought to increase at less than 1% a year.  If the UK food industry were to grow its revenue (in real terms) at a faster rate than the population growth rate we’d either have to throw away a lot of food, get fatter, or export more of our food output.  Sadly, there is a lot of evidence we’re doing the first two, but let’s suppose that we can, as a nation, take control of both our waste and our waist and consume food at a steady state.  How, then, could the food industry grow its year-on-year revenue faster than the population?

The obvious way is to charge more for the same (amount of) food, leaving consumers with proportionately less money to spend on other goods or services.  In this case, the food industry would only be able to grow its market share of consumer expenditure at the expense of other suppliers of things we spend money on.  Unfortunately for the food industry, many of those competing industries aren’t constrained in the same way, and have greater (though never unlimited) capacity to generate and manipulate demand for their product.  The advantage the food industry has in this competition is that it benefits and will always benefit from a continuous and sustained demand for its output – we all have to eat – with far less consumer discretion over whether and when to buy it.  But that is also a major disadvantage in an economy where there is a seemingly universal imperative to grow faster than the population.  I can perhaps be persuaded to buy a new iPad every year instead of every other year, but I hope I doubt I could ever be persuaded to eat twice as often, or twice as much, as I do now.

Posted in Uncategorized | Tagged , , , | Leave a comment

An Experimental Mix of Birds, Psychology and Art

Death 5 compBackground

For the past year, I’ve been a member of the ‘Larks and Ravens‘, an experimental group of two artists and a psychologist. We’re exploring how to create visual contexts which trigger people into seeing their world differently for a moment.

We’d like to find ways…..

  • to disturb elements of our everyday contexts (a supermarket, a bank, a workplace ..) to glimpse that what we accept as the reality of our everyday world might actually be illusion or fantasy and it could be different,

  • to create destabilising moments which help us spot how strange our world is or how irrational we are,

  • to make more visible the narratives, myths and voices which shape our thinking but which we are often blind to.

We hope this will stimulate conversations about topics which affect us all but which we rarely discuss with one another. Examples include: climate change, death, economics and social inequality.

Space Explorations Exhibition

Following a few one-off events, the Larks and Ravens has just finished its first ever installation in the Tobacco Factory Cafe/Bar in Bristol which ran for 10 days during September. We were delighted that the Tobacco Factory offered us this opportunity to explore some of our ideas in a friendly, flexible space frequented every day by a large and demographically varied population. People use the Cafe/Bar to grab a Latte, work on their laptops or hold informal business meetings. Mothers with babies use it to meet for lunch and chat. Single older folk come in each day to sit and read the paper, chat to others and enjoy the food and drink. Mothers and carers pop in with their children after school and then, after work, it becomes a noisier, busier crowd with a younger demographic.

We called the installation ‘Space Exploration : Climate Change Conversations’ and it involved 3 elements.

Questions – around each of the tables in the cafe, we placed an array of 30 plus questions as a way of catching attention and stimulating conversation while people sat and Growth compdrank or read their laptop or paper. Examples included:-

  • How green is Bristol?

  • How can a democracy tackle climate change?

  • Who is writing the story?

  • Fragile compIs human progress a myth?

  • Which is more important – economic growth or the environment?

  • Does it matter if our species dies out?

Comms compBooths – we constructed and installed 4 booths. These were made of recycled cardboard and the idea was to introduce mini spaces or contexts which people could step into and reflect on or respond to questions about climate change within those different environments. This idea was based on psychological evidence that our behaviours are governed to a significant extent by our current situation or context. Even our bodily positions (standing upright, sitting down, fists clenched, arms folded, etc) as well as whether our immediate environment is comfortable, uncomfortable, hot, cold, clean or dirty can affect our outlook and responses to seemingly unrelated topics.

We recognised that we encounter such booths in our everyday lives – each carrying its own meaning and emotional or behavioural associations. The 5 booths we constructed were as follows:-

A shower booth – a space associated with privacy, intimacy and cleanliness.

A confessional booth – a space associated with religion, guilt and confession.

A communications booth – a space associated with contacting and talking to or listening to voices elsewhere.

IMG_1524A photo booth – a space associated with appearance, image and identity. Unlike a standard photo booth, we covered ours with a reflective material which distorted images. We hoped this would help people realise that everything we see is distorted in some way or another.

A polling booth – a space associated with civil responsibility and individual choice.

Because of limitations of space, we didn’t install the polling booth in the end.

Death 4 compSpectres – at our previous events, we had experimented with introducing various ‘spectres’ – faces and figures who are either influential voices in our current world (e.g. George Osbourne, the pope, Jeremy Corbyn, Malala Yousafzai) or represent symbolic voices like scientists, artists, children and gods. We have found that the spectres create visual interest, provoke a reaction (both Photo booth comppositive and negative) and, hopefully, help people recognise the presence of such voices in our lives and the effect they have on us. In the Tobacco Factory installation, we created some of spectres from cardboard and sat or stood them around the space. We also provided some ‘spectres on sticks’ in the photo booth so people could opt to take selfies with their favourite spectres.

We invited photographer, Jon Phillips of Muen Photography to visit the installation on two separate days and take photographs of the installation and people’s engagement (or non-engagement) with them. His photographs illustrate this article.

On the last evening, we ran an open event inviting people to discuss the issues raised by the installation and respond, if they wished, by writing or drawing on the tables and/or the booths.

What happened?

Pope compAt one level, it’s hard to know what happened as we were only present for short periods during the 10 days that the installation was in place. We did invite people to give us feedback via Twitter, text messages and voicemail but this didn’t happen to the extent we had hoped. We overheard some friendly feedback – people Putin's view compwho enjoyed “having tea with the pope” or “sitting close to Death” and we enjoyed watching children using the spectres to play with as puppets in the photo booth. We also witnessed some hostile reaction – people not liking their social space being invaded with challenging questions or images (or artists making things!) or declaring that they “don’t believe in climate change”. Some questions caused offence (e.g. “is environmentalism religious?”) as did us being seen to be playing with images of respected public figures.

Give up compThe installation certainly made a visual impact on the cafe/bar area. The questions round the tables were eye catching. The booths looked curious and inviting although locating them appropriately in the somewhat crowded bar space was less than ideal. Some of the spectres (most notably death!) ‘looked the part’ and inhabited the space very naturally. Other spectres weren’t as well constructed (by us) or looked awkwardly out of place.

The photographs taken by Jon Phillips of Muen Photography were compelling in the way they juxtapositioned random questions with people chatting or reading at tables.

Human pinnacles compHowever, the irony was that most people actually ignored the ‘eye catching’ questions on the tables – possibly not even registering their presence. This makes Jon’s photos even more powerful as an illustration that these questions (and others like them) might be all around us every day but we ignore them or are unaware of them because we are entirely focussed on our everyday Newspaper compconversations and concerns. Studies have shown that  perception of an environment is dependent upon people’s internal goal states. For example, people see desirable objects as being physically closer to them than undesirable objects. Such effects may be one of the major learnings from the installation.

Confession 2 compSimilarly, we had hoped that the 4 booths would spike people’s curiosity (“what the hell is that doing there?”) and encourage them to step inside different symbolic contexts which could affect their behaviour and responses to the climate change questions posed. We certainly found that entering one of our booths (particularly those with curtains) felt different – certainly a ‘stepping out’ of the busy social bar and café space.

However, it appeared that the familiar context of the Café/Bar held such dominant meaning and associated behaviours for people that our small ‘out of place’ booths couldn’t Shower 1 compcompete with that. We watched people enter the Tobacco Factory and head straight to the bar to order their drinks or seek out a friend so focussed on that activity that they walked straight past our shower booth without even glancing at it. It reminded us of the ‘Inattentional blindness phenonmenon where viewers asked to count the passes made by basketball players in a short video fail to notice a gorilla which slowly walks across the screen. In a more serious experiment, 83% of radiologists failed to see a gorilla image when checking lung X rays for cancer. Again, this was a significant lesson for our work. Because of selective attention and the power of context, it is much harder to disturb people’s familiar environment than we had envisaged. We see and hear what we expect (or want) to see and hear and fail to see what we don’t. That is a major challenge for our work – how do you fit in with an environment enough that people notice what you’ve done but introduce things which are strange or unfamiliar enough to surprise and challenge ways of thinking and acting?

On Reflection

Viewers compSome people have already asked me “was the installation a success?”. I don’t know how to answer that as I’m learning that such questions don’t make sense in work like this – art is about the process, not about achieving an aim. However, as an experimental psychologist, I realise that it’s much the same for me. Each experiment (formal or informal) moves your thinking and understanding on and the experiments which “work” (whatever that means) are often, in the long run, less significant than the ones which didn’t “work” or certainly didn’t turn out the way you expected.

So, as larks and ravens, we now reflect through writing, drawing and talking as we ponder our next experiment……

Thank you to my fellow artist larks and ravens: Pip Woolf and Kirsty Claxton for introducing me to new ways of being and experimenting….

Writing compIf you’d like to respond to the Larks & Ravens’ work, then we have a shareable Textwall – where you can post a comment directly or, with a mobile ‘phone, text L&R followed by your message to 020 71 83 83 29.


Posted in Psychology | Tagged , , , , , , , , | 1 Comment

Energy Storage – Report of Smart Energy Wales Conference

The Prospectors recently attended a 1 day Conference organised by Smart Energy Wales on energy storage and smart grids. It was billed as ” bringing together the most experienced practitioners from industry, academia and the public sector to provide insights and practical examples of smart energy deployment.”

Peter wrote up a report on what we learned – mostly for our own reflection and digestion but we are happy to share it with others. It is quite lengthy(!) and not entirely neutral but there is a 1 page summary right at the end if you are short of time or attention span! Enjoy.


Posted in Uncategorized | Leave a comment

Electric Car Running Costs

Individuals don’t generally buy things for their collective benefit, so industry and government would be wasting their time trying to persuade us to buy electric cars because they offer a better long term personal transport solution for society and the environment.
Electric cars are more expensive because of their lower volumes and expensive batteries. Government subsidy can help industry reach the volumes and reliability required to reduce manufacturing costs, while industrial R&D will make batteries cheaper.

 
Fortunately, electric vehicles should be cheaper to maintain and cheaper to run. They already offer lower fuel costs which allied to the convenience and efficiency of being able to recharge them at home, may be enough to persuade some drivers to switch.
Electric car fuel costs are far lower than those of petrol or diesel cars.  Nissan claims “just 2p a mile” for their Leaf, which can just about be justified if you ignore battery depreciation and use the cheapest possible electricity.

 
By comparison, a modern combustion engined car that delivers 50 mpg – about 11 miles to the litre – works out (in mid 2015) at about 11p a mile in fuel. That’s over 5 times the fuel cost of an electric car costing 2p a mile.  A combustion engine also consumes lubricating oil and its propulsion system requires continual servicing which adds to its per mile running costs.  But is electricity the only per mile expense an electric car incurs?

 
The Nissan Leaf, according to the United States Environment Protection Agency (EPA), requires 30kwh of electricity “from the wall” to drive it 100 miles.  This means you need 300 watt-hours of electricity from the power company for every mile you drive.
300 watt-hours of electricity (according to the UK’s Energy Saving Trust) costs 4.2 pence on a standard day time tariff in the UK.  But Nissan Leaf owners can charge their cars at the night-time rate of about 2.16p a mile – which is in-line with Nissan’s claim of “just 2p a mile” claim, particularly when you factor in free recharging at public charge points.  Free charging may not be available forever, but it’s currently possible to run a Nissan Leaf for the 2p a mile claimed.

 
The motor and transmission of an electric car are maintenance-free and should last as long as the car, eliminating many of the running costs of petrol cars.  But there is one component of an electric car that “wears out” – the battery.  No-one seems entirely sure how fast or by how much an electric car battery wears out over time and distance, but no-one is expecting it to last as long as the car.

 
Electric car batteries are rechargeable but they can’t (yet) be re-charged an indefinite number of times.  And they are expensive – for many electric cars they account for between a quarter and a third of the purchase price. Since every kWh of electricity passing through a battery reduces its future capacity, you would think that the cost per kWh of battery throughput would be more widely known and could then be factored into the cost per mile of driving an electric car to compare it to petrol and diesel car costs.  The reason it isn’t may be obvious to a cynic, but to be fair to the manufacturers, battery wear isn’t constant and depends on a number of factors.  It is also improving and may eventually reach the point where the battery will last as long as the car.

 
A lot of research goes into improving the cost, capacity, density and lifetime of batteries, factors which interplay in obvious and not so obvious ways.  Ideally, we’d like our electric cars to go as far and as fast as a petrol or diesel one, take about the same time to refuel, and cost about the same to buy.  We’re some way from being able to offer this at an acceptable price (though edging closer year by year) but at this stage we have to make compromises to get the best we can out of the technology in its current state.

 
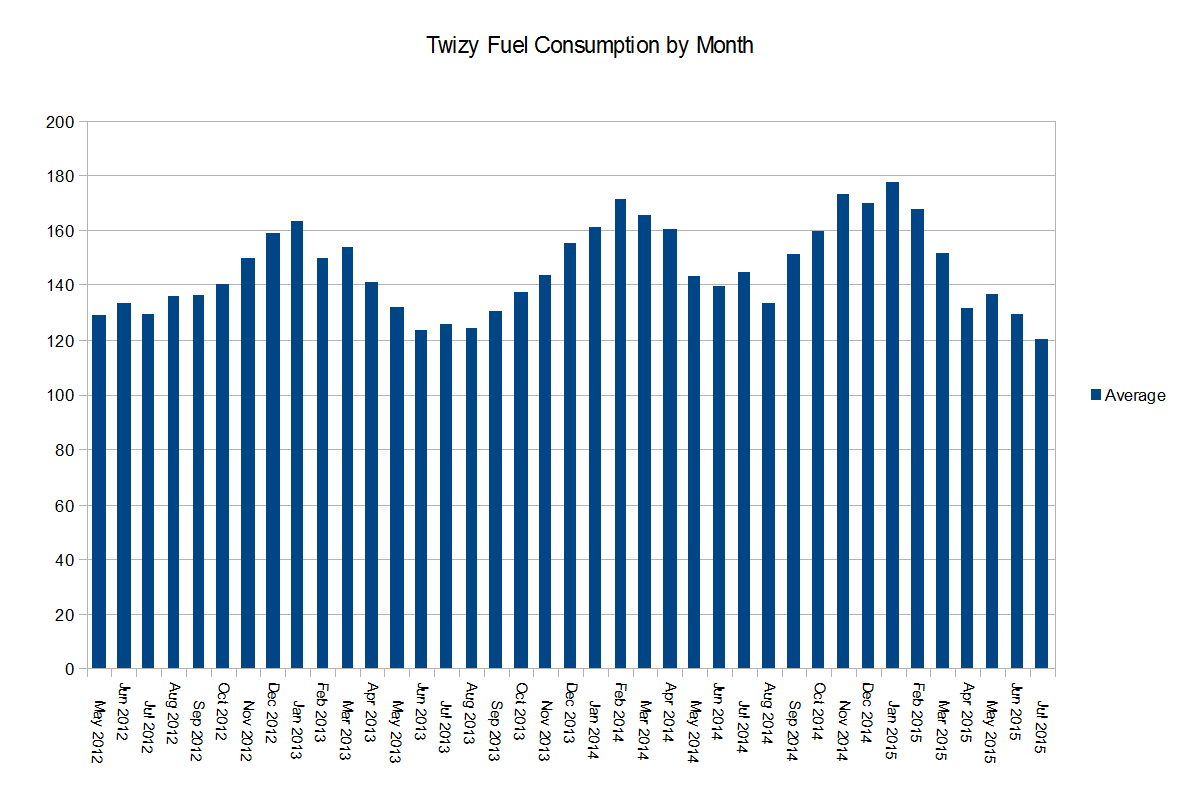
We own a small electric car called a Twizy.  Its batteries hold just over 6kWh (6 units) of electricity, which is large enough to take it 50 miles in summer but small enough to re-charge it from a normal domestic socket in about 3 hours from “empty”.  The Twizy is very light, and can only carry two people, but its batteries (at 100kg) account for over 20% of its total weight of 480kg.  Over the course of 3 years and about 11000 miles of motoring, our Twizy has averaged just under 143 “wall” watt-hours per mile – which equates to about 114 watt-hours from the battery.  As every electric car driver knows, consumption varies with temperature, load and speed.  Here’s a graph of our consumption over the 3½ years since we bought it, aggregated by month to make it a bit less “spiky”:


TwizyConsumption

Fig 1:  Twizy Fuel Consumption in “wall” watt-hours per mile

143 wall watt-hours per mile is more than twice as energy efficient as a Nissan Leaf, so Renault could claim on the same basis as Nissan that it costs “less than 1p a mile” to run a Twizy!

 
However, the Leaf is a much bigger and heavier car, can carry 4 people, and drive over 90 miles on a full charge compared with the Twizy’s 50. To do that, it needs 24kWh of battery, weighing 300kg (about the same as another 4 passengers). So a Nissan Leaf requires 3 times the battery weight and 4 times the battery capacity to carry twice as many people not quite twice as far.  Measured in watt-hours per passenger mile when fully laden, it blows the Twizy away (as would a full electric train). But with only the driver, the Twizy wins hands down in fuel efficiency for any trip both can do.

 
The longest range electric car on general sale is the Tesla Model 85 which can travel 250 miles. To do this requires 540kg of battery with a capacity of 85kWh.  So, to go less than three times as far as a Nissan Leaf, the Tesla needs more than 3 times the battery capacity.  And while that doesn’t quite result in 3 times the battery weight, the energy required to accelerate and lift that additional battery weight will use some of its additional capacity.  This is why it needs more than 3 times the battery to go less than 3 times the distance.  According to the U.S. EPA, the Tesla 85kwh car requires 380 “wall” watt-hours per mile compared with the 300 wall watt-hours per mile of the Nissan Leaf and the 143 wall watt-hours per mile of my Twizy.


But electric car batteries lose a little of their capacity each time they are filled and emptied.  Manufacturers don’t publicise the number of discharge cycles it takes for that loss of capacity to become significant, partly because it varies a lot with driving style, charging regime, and temperature.  As a result, it’s hard to factor battery capacity loss into the per mile running cost of an electric car, but we can make some educated guesses.
We’ve now been driving our Twizy for over 3 years, and this must have affected its capacity but it’s hard to see by how much. Here’s another graph showing the mean “range” of our Twizy over the time we have owned it.  As you can see, this too varies with the season and, as any electric car driver will tell you, is subject to “range estimate” generated by the car, which can be misleading.  The figures were recorded before each full charge and are the sum of the miles driven since the last full charge plus the car’s remaining range estimate at the start of the recharge.

TwizyRange
Fig 2:  Projected Range in Miles

As both graphs show, our Twizy’s range and consumption figures, even allowing for the smoothing effect of amalgamating each month’s figures, vary.  They mainly show the effect of temperature but there are (inconclusive) signs of battery wear if you are looking for them.

If, for example, we take the range estimate for the same month each year, the midwinter range dropped 12% but the midsummer range less than 4%. At a rough estimate we may have lost around 5% of our battery in 11,000 miles.  Since lithium batteries in 2012 cost just under £500 per kWh, ours were worth a bit under £3000. If we treat that 5% loss of capacity as a 5% depreciation in value then we’ve lost £150, which works out at just over a penny a mile which we need to add to the just under a penny in mains electricity.

Bear in mind that these figures are distorted by the fact that batteries depreciate for other reasons. Furthermore, with a Twizy we do not own the batteries but have to rent them for £45 a month with a guarantee of at least 70% capacity over the period of the contract. £45 a month for 39 months is £1755, which works out at a whopping 16p a mile! However, the rental contract amount also finances the initial battery cost, breakdown recovery and routine servicing, so any actual per mile figure due to wear is very difficult to isolate.

Nissan Leaf owners, on the other hand, do own the battery and will need to buy a new one when it “runs out” [or its capacity drops to a level they can’t accept].  A UK-based Nissan Leaf taxi operator recently reported the loss of the first 10% of his battery capacity having completed 112,000 miles and he was very pleased with that, as well he should be.  If his original 24kWh battery pack was worth about £12000, then his battery loss of value also works out at just over a penny a mile. However, other Leaf owners have not been as lucky, one reporting a 33% loss over 62,000 miles – which in UK terms would be over 6p a mile. The most disappointing case was 46% loss over about 70,000 miles, closer to 8p a mile.

The bottom line is that battery decay is a significant additional per mile cost for electric cars, but they still offer far better fuel economy.  And this is just as well because that’s why we need to switch to them. Until we can replace fossil fuel as our primary energy source, electric cars have to deliver better fuel efficiency to be worth their government subsidy.

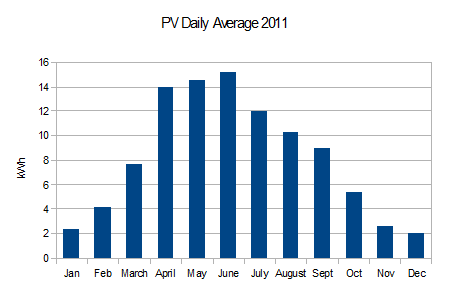
It is ironic, in this respect, that our Twizy receives no government subsidy, while a Tesla Model S does.  At 380 wall watt-hours per mile (236 Wh/km) the carbon emissions of a Tesla charged from the UK grid generates well over 100g of CO2 per km, so it would not qualify as a low carbon vehicle were it not electric. Our Twizy, on the other hand, generates about 38g of CO2 per km when charged from the grid at night, or none at all when charged from our solar panels on a sunny day.

Posted in Uncategorized | Tagged , , , , | Leave a comment

Chaotic or coherent behaviour?

Many years ago, we did some collaborative research on ant behaviour with a delightful group from the University of Bath. The way it challenged our thinking about human behaviour has stayed with us ever since.

This recent article provides a powerful illustration. The reported study shows the video of a team of ants successfully carrying a Cheerio biscuit back to their base. It leaves us wondering – can the multi-layered chaos of our political systems lead to coherent direction and achievement? We have to hope so – i.e. that we are a bit more like ants than we would like to think.

Posted in Psychology | Tagged , | Leave a comment

Working on ideas which go against the mainstream

Refreshing to read a synopsis of Malcolm Gladwell’s latest book ‘David and Goliath, Underdogs, Misfits and the Art of Battling Giants‘.  In particular, Gladwell talks about the French Impressionists who were exploring a radically different way to paint and were being rejected at the time by both the public and the art institutions and art shows and consequently they were broke. To be accepted, they would have to revert to painting like everybody else. Fortunately for all of us, they were brave enough to stick with their innovative techniques and survived by starting their own small alternative art show. Gladwell suggests that there can be benefits to being small and out of the limelight. It can, paradoxically,  bring you more attention in the long run than if you try to play in the big leagues.

The Prospectors, who sometimes find themselves developing projects and ideas which run counter to mainstream thinking, find this somewhat reassuring.

Posted in Uncategorized | Tagged , | Leave a comment