May 2016 to January 2017

This month saw a small increase in solar output, offset by a major face-lift on our house which increased our electricity demand – the cement mixer and jack hammer are both electric!    So although the solar output has started its slow recovery after the Winter solstice, the proportion of our demand met by solar energy – either directly or via the battery – remained about the same as December.

bertaverages

bertpercentages


Posted in Uncategorized | Leave a comment

May to December 2016 – Domestic Solar Battery Data

“‘Tis the year’s midnight, and it is the day’s,
Lucy’s, who scarce seven hours herself unmasks;
The sun is spent, and now his flasks
Send forth light squibs, no constant rays;”

So, how has Bert, our Wattstor solar battery, fared in this darkest month of the year?

The chart below shows the daily Wh averages for each of the 8 months we’ve had the system. It shows our daily demand, the solar PV input, the amount we’ve had to import from the grid and the amount we’ve exported to the grid because it’s more than the battery can absorb at that point in time.

dec-avsOur demand stayed fairly level at around 8kWh per day. The solar dropped to an average of 2.3 kWh a day and it rarely got a chance to generate a surplus (over the amount the house was using) in order to top up Bert-the-battery. It still managed to export an average of 408 Wh/day to the grid when we would (selfishly) rather have that stored in the battery for our own use! Still, at least it’s public spirited and we are being paid for everything we generate.

The 2nd chart shows the proportion of the electricity we have used each month which is provided by each source – either directly from the solar panels or from solar stored in the battery or from the grid.

decpercentNot surprisingly, 84% of the electricity we consumed in December came from the grid. We still got 8% from the solar panels directly and 7% solar via the battery.

It’s now January and already the sun is disappearing behind the hill a few minutes later each day so stay tuned for a bigger yellow and orange bar in January.

Posted in Technology | Tagged , , , | Leave a comment

In a world without jobs, how do we prosper?

The concept of a universal basic income (if a way can be found to achieve it) could help address a combination of problems. It would replace the administratively complex, expensive and psychologically debilitating benefits system. It would avoid people doing jobs which don’t pay enough for them to live on. It would allow people to give up a job they hate in order to study or to develop or practice a skill or to look after an ageing relative. It also addresses a future where increasing automation means there are fewer and fewer permanent jobs. If we also factor in so-called “bullshit jobs” – i.e. jobs which seemingly make no difference whether anyone does them or not, then an alternative form of income would be even more welcome.

But, if a universal basic income could pay every UK citizen enough to cover their basic needs whether or not they had a job,  what would people then do with their lives – could they flourish without ‘a job’ to go to?

A number of research bodies are now exploring what constitutes individual and societal well-being or prosperity when that is decoupled from our current way of measuring it solely in terms of GDP. As, Robert Kennedy famously pointed out 50 years ago the Gross Domestic Product …measures everything .. except that which makes life worthwhile”.

I’ve never studied the role which paid employment plays in our sense of well-being once we have enough income to cover our everyday needs. But I have studied other kinds of experiences outside of work which we don’t get paid for but which clearly energise and satisfy us. Can we learn anything from those?

A few days ago, I reread some behavioural research which I carried out a while ago. We were exploring how and why experiential consumer products were compelling – often more so than material products. Over a period of years, we had worked with clients on experiential products in some very different domains: art, sailing, digital technology, rugby and education. As we analysed the language people used to talk about their experiences (good, neutral or bad), a clear pattern emerged of 3 distinct but overlapping dimensions which increased people’s enjoyment, engagement and a desire for more.

The 3 dimensions which emerged were: stimulation, individual expression and social connection. Not all 3 were present in all experiences but when they did combine, those were considered the most powerful and engaging experiences.

Stimulation

This was the degree to which the experience stimulated either people’s physical senses –  their sight, sound touch, taste or smell – or their minds – their intellect, ideas or imagination.

Individual expression

This was the degree to which people could express their personality, skill or creativity though the experience – i.e. make the experience unique and different through their  interaction with it.  In all the domains we studied, we found that this dimension created the most deeply satisfying experiences which last the longest after the stimulating event is over.

Social connection

This was the degree to which the experience triggered a sense of belonging or intimacy with others. In some cases, this came from the shared exhilaration of achieving a challenge together or sharing a moment of intense emotion. In other cases, it was competitive – feeling a rush of adrenalin from pitching their wits or skills against another person.

It seems likely that the world of work operates on the same 3 dimensions. Where people are lucky enough to have a job they really enjoy, it’s probably because it scores highly on one or (if they are lucky) all 3 dimensions. They are physically and/or intellectually stimulated; they can express their individual creativity or skill and affect what happens and they feel part of a vibrant social group achieving things together or matching themselves against others.

Conversely, if they lose their job or are stuck in a “bullshit” job, then their language  probably reflects the painful absence along one, if not all of the 3 dimensions. They are bored and depressed – lacking any challenge or new ideas or imagination. They feel that they have nothing to contribute, they aren’t able to make a difference and have lost a sense of their identity and self-worth. Finally, they feel isolated – they no longer belong to a social group who share a common activity and purpose. I’m guessing (but I don’t know) that even if they received the same income as when they had the job, they would still feel negatively along our 3 dimensions as none of these (I think) are strictly dependent on the actual ££ income involved. (Although the amount you currently get paid can be interpreted (albeit inaccurately) as what you are worth in capitalist rather than social terms).

It would be interesting to test the correlation between pay and well-being in terms of the 3 dimensions.

The fact that the positive experiences which working can deliver might be independent of  income gives me hope for people’s sense of well-being in a world where there are no jobs for a vast swathe of the population. If there is a means whereby everyone can be provided with a universal income which covers their basic needs, then the challenge is for all of us to find and develop diverse activities and experiences which pay no money but deliver just as compellingly engagement (in many cases much more) along one or more of the 3 dimensions discussed. For society’s sake, we also need these to contribute to the well-being of communities. Professor Tim Jackson’s recent discussions of the human service sectors of the economy namely care, craft, culture and creativity might be a way to explore this further.

But, how we can test this in the messy real world? I don’t currently know but even thinking about the possibilities engages me (whilst not being paid by anyone directly to to do so!) along at least two of the experiential dimensions!

Posted in Psychology | Tagged , , , , , | Leave a comment

May to November – our solar battery data

The latest update – 7 months with Bert our Wattstor battery (May to November).

November here in Wales has been pretty murky until the last week. We also lose the sun over the hill behind the house at around 2:30pm at this time of year.   The lead acid batteries only ever operate between 50% and 100% capacity. In the summer, the batteries would regularly fill to 95-100% during the sunshine hours and then empty each night down to ~50% before switching off. Now the solar isn’t providing many Wh to the battery, the Victron controller switches off the battery when it drops to 85% . Basically it releases roughly the amount it has captured that day so allowing it to cycle around in the top end of its limit (rather than the bottom) to better preserve the battery.

This chart shows the daily Wh averages – our daily demand, the solar PV input, the amount we’ve had to import from the grid and the amount we’ve exported to the grid because it’s more than the battery can absorb at that point in time.nov1

Our daily electricity demand stays roughly the same – an average of just over 8kWh per day. Charging our electric Twizy a few times a week makes a big difference to that day’s consumption and, unfortunately, those extra kWh are all coming from the grid now.

The sun meanwhile, as John Donne so eloquently points out, “is spent, and now his flasks send forth light squibs, no constant rays” – the “light squibs” in our case amounting to a paltry 3 kWh/day. This means that, for the first time, we are importing more from the grid than our solar is generating.

We continue to export a small amount to the grid each day (612 Wh). It’s hard not to resent this but it happens when the solar at midday is generating more than the battery can absorb.

The 2nd chart shows the proportion of the electricity we have used each month which is provided by each source – either directly from the solar panels or from solar stored in the battery or from the grid.

nov2

Unfortunately, most of our electricity (76%) is now coming from the grid but 24% is still coming via the solar and this would be down to 13% without the battery which is still making an 11% contribution.

Here’s hoping for a crisp sunny December….


Posted in Technology, Uncategorized | Tagged , , , | Leave a comment

Exploring value in Aldi

unspecified
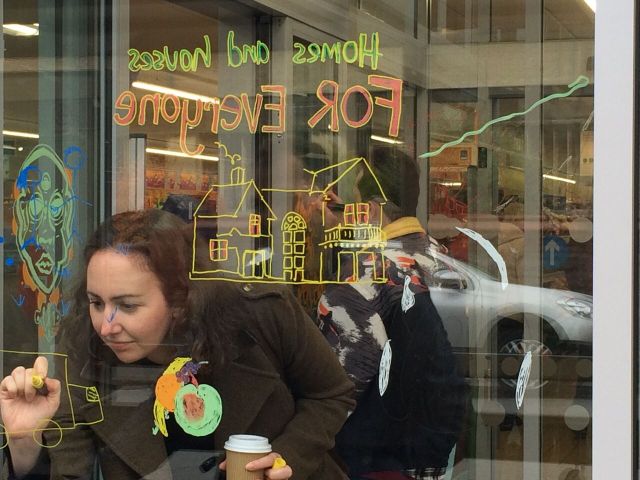
I am part of the experimental art group Larks and Ravens and we recently ran a Big Draw event where we invited customers in a Bristol Aldi store to draw what they valued on the shop windows! It was a fascinating and fun day and you can see some of the images and read a bit about the values which emerged on the Larks and Ravens blog.

Posted in Psychology, Uncategorized | Tagged , , , , , | Leave a comment

May-October – Our solar battery data

So, here’s our 6 month update of life with Bert our Wattstor battery (May to October). Every month we learn new things.

As well as the shorter days, October has been rather misty and murky but still our 4 kW PV panels are often generating enough during the middle of the day to cover our energy demand in real time and, after dark, Bert-the-battery is still often able to service our evening cooking (which is mostly done on electric).

The first chart shows daily Wh averages – our daily demand, the amount generated by the solar PV, the amount we’ve had to import from the grid and the amount we’ve exported to the grid because it’s more than the battery can absorb at any point.

mayoct2

Not surprisingly, our daily demand has now crept up to an average of 8.5 kWh/day. This increase (we think) is a combination of  lighting and the pump for the boiler. We’ve also had two lots of visitors in October which always makes a difference!

The solar is now dropping significantly (5.2 kWh/day) because of shorter daylight hours, the sun lower in the sky and it disappearing behind the trees and October being rather dull.

We’ve imported almost twice the amount from the grid than we did in September (5.o kWh/day). One big difference is that our Twizy (which also has a 6kWh battery) and charges at 2kW can no longer charge reliably directly from solar during the day so we have switched to charging the Twizy from the grid after dark to avoid pointlessly taking energy from one battery to fill another. Looking at these data certainly brings home to you what it would be like if we owned a full sized electric vehicle. They are energy hungry beasts and no domestic solar system is going to be able to cater for them all year around. Fortunately, the Twizy (which manages all our local journeys) operates at 140 Wh/mile which is why we chose it.

And, finally, the system has rarely been in enough solar credit during the day to export to the grid rather than filling the battery. So, the amount we have exported has dropped to 1.2 kWh/day which means we are not currently contributing much to our fellow citizens! (Neither incidentally are the many domestic hydros around our area as the mountain streams have dried to a trickle given the lack of rain for a month or more).

Another big change is one that has been programmed by the Victron system. The lead acid batteries only ever operate between 50% and 100% capacity. In the summer, the batteries would often fill to 95-100% during the sunshine hours and then empty each night down to ~50% before switching off. Once the solar stopped providing that many Wh to the battery, the battery started switching off at around 70% – 75% . It appears to be estimating the amount it’s likely to manage top up by the following day and aiming to cycle around in the top end of its limit (rather than the bottom) to best preserve the battery.

The 2nd chart shows the proportion of our daily electricity provided by each source and how that is changing each month:-

mayoct

As already mentioned, the amount we are now taking from the grid has almost doubled from September but we are still getting 40% of our demand via solar and this would be down to  21% without a battery. It’s interesting that the split between solar (direct) and solar time-shifted via the battery remains roughly equal. Will that still be true in mid-winter?

Posted in Technology | Tagged , , , , | Leave a comment

1000 footsteps, foraging & mere exposure

img_20161022_195016Last Saturday night, I attended the inaugural 1000 Footsteps pop up restaurant event. Adele Nozedar is a foraging guru and her partner, Liam Fitzpatrick a chef. Together they are creating unique meals where the vast majority of the ingredients have either been gathered from the hedgerows or grown within 1000 footsteps of their home in the Brecon Beacons National Park.

30 of us sat by candlelight in the warmth of a blazing log fire in Llangasty village hall as Adele and her team produced dish after dish after dish throughout the evening. Each dish exotically named with little or no resemblance to food we’d seen, heard of or tasted before – “drunken chicken in the woods”, “poor man’s cheese” etc etc.

Much laughter and interesting conversations reverberated round the table triggered by the many novel looking, sounding and tasting ingredients. But after a couple of courses, I found myself increasingly craving something familiar – “please please give me a taste I can recognise – one to which I can attach a known adjective!”. It’s not that I disliked any of the completely new tastes but I found I wasn’t particularly relishing them either in the sense of “wow, give me more of that!”

So, then the psychologist kicked into action – what was happening here? Did I not like foraged foods? Why was my brain almost shouting to be given something it recognised – something to latch onto.  At that point, I realised I was experiencing the “mere exposure effect” in action.

img_20161022_201815Mere-exposure is a psychological phenomenon by which people tend to prefer stimuli to which they have been previously exposed and the more they are exposed to them, the stronger their liking grows. Experimentally, the mere exposure effect has proved robust across all kinds of stimuli – visual images, music, words and tastes. And, intriguingly, stimuli which you are not conscious you have encountered before (because they were presented subliminally for example) show an even greater effect on liking than ones you are aware you’ve encountered before. One explanation for mere exposure is that we favour things which take our brains the least effort to process.

So, whilst hesitant to offer advice to an experienced forager and talented chef, I have two thoughts on their 1000 Footsteps venture from a psychology perspective…

I suggest subtly re-introducing some of the more novel ingredients from Course 1 into Course 3 or 4 and see if people like them better 2nd time around whilst not necessarily realising they have actually tasted them already! Also combining the unknown (taste wise) with more of the known and familiar might help the more novel-nervous. Research shows that we improve our chances of developing a liking toward a new experience if that experience has at least some familiar elements in it.

And for those of you out there who haven’t yet signed up for a 1000 Footsteps pop up dinner, my advice is ‘go for it!’ It’s a fabulous experience and by expanding the tastes which you’ve now experienced (if only once!), you stand to significantly increase the enjoyment you derive from eating …..or for that matter anything!

Posted in Psychology | Tagged , , , | Leave a comment

Living with Bert-the-Battery for 5 months

We’ve now had our Wattstor 6 kW battery (‘Bert’) for 5 months. The first chart shows our daily kWh averages and how they are changing as summer tails off into autumn.  Our daily average demand (red) has remained relatively consistent at 7.5-8 kWh a day other than June when we had 2 weeks away.

maysepavs

The PV generation (yellow) is dropping sharply with the shorter days and lower sun in the sky which (in our case) disappears behind two trees in the adjacent field in the afternoon. The average surplus kWh we have exported to the grid each day (green) is falling and the average we have had to import from the grid (black) is now rising sharply. September was the first month we have taken more from the grid than we exported to it.

For many happy days in high summer, the PV panels and Bert met all our demand and we imported nothing from the grid at all. But in September, the daily import needed from the grid rose sharply once we were cooking supper after dark and Bert could no longer reach 100% capacity from the day’s sun.

The second chart shows the proportion of our daily electricity demand which came from each source and how that is changing month to month.

maysept1

The grid provided only 4% of our electricity in June and July but in September was up to 33%. The proportion of energy we take from the solar panels directly versus from the solar via the battery is also changing. In the last two months we have taken a higher proportion from the battery than directly from the sun. Again, we think this is because our consumption peaks in early evening (like most of the population!) when we are cooking (mainly on electric) after the sun has set.

Thierry Twizy above Usk Reservoir

Thierry Twizy above Usk Reservoir

On the days we need to charge our Renault Twizy, the solar PV (4kW) is rarely able to consistently provide all of the power required (2kW) for a few hours so the rest is taken either from Bert-the-battery (if he’s full enough) or the grid.

Fortunately, our Twizy only has a small battery 6kWh (same capacity as Bert) and operates at very low energy (140 Wh/mile). In this country, you’d need a huge South facing property with maybe 8-12 kW of PV panels to be able to charge a full-sized electric vehicle every day and still have surplus Wh to fill a domestic battery. And, as discussed previously, we now think it would be horribly complex to double one’s electric vehicle battery as domestic storage. The two usage patterns are too often in direct conflict.

Posted in Psychology, Technology | Tagged , , , , , | Leave a comment

Is playing golf on a Friday afternoon such a bad thing?

Liam Fox recently told an audience of Tory activists that it’s the “duty” of our business leaders “to contribute to the prosperity of our country”. Instead, Fox complained, they are letting us down by choosing to play golf on Friday afternoons rather than spending the time finding new export markets and growing their businesses.

The UK business community were understandably up in arms about Fox’s comments – particularly his description of them as having become “fat and lazy” on past successes. Businesses and other politicians were quick to point out how hard all businesses work with no time at all for playing golf.

But, what if we look at both Fox’s comments and the reaction of businesses and the media to his outburst through different eyes?

Why is playing golf on a Friday afternoon rather than working to grow the market for your business such a bad thing? Is it because it’s golf – arguably an elitist, rich man’s sport? What if these business leaders take Friday afternoons off to walk in the country with their partner, or visit an elderly relative or sing in a choir or play football with their kids? Would we deem that a better or worse way to spend an afternoon than signing up new trade deals? And what if the business leader in question also gives all his or her employees Fridays off to spend doing something of their own choice other than work? Does that contribute more or less to the ‘prosperity’ of our society? What if some don’t even want or need their business to grow – is that bad or ‘undutiful’? Maybe they are quite happy at its current size and turnover and would rather they and their employees had time for other interests in life and time to spend with friends and family?

It depends how we understand national or individual prosperity and whether it is actually  dependent on our GDP in the way that successive governments clearly believe. As Professor Tim Jackson points out in his book ‘Prosperity without Growth‘ “The narrow pursuit of growth represents a horrible distortion of the common good and of underlying human values“.  Robert F Kennedy recognised this right back in 1968 “the Gross National Product measures everything in short, except that which makes life worthwhile“.

So what if we consider an alternative definition of prosperity as “a successful, flourishing, or thriving condition“? That certainly challenges whether spending Friday afternoons working hard to negotiate new trade deals and thus expand shareholder dividends represents the best way to contribute to one’s own or the nation’s prosperity. It’s also a definition of prosperity which might stimulate a wider debate around the possibility of a universal unconditional income as a way to cope with the reduction in paid jobs and reduce the ever-widening gap in equality. In contrast, Liam Fox’s call of duty to grow business and shareholder profit will certainly do little for economic equality.

Having never played golf and with no desire to do so my advice is nevertheless: “enjoy your Friday golf …. but think about giving all your employees the afternoon off too….”.

Posted in Psychology, Uncategorized | Tagged , , , , , | Leave a comment

Simply touching money makes us less helpful

I’m working on a project with the artist group, Larks and Ravens, on the topic of money – what is it?, where did it come from? what’s it doing? And how on earth did we get to a point where inequality has grown to a point where 62 billionaires own as much as the poorest half of the world’s population?

Two independent pieces of information caught my attention today  – both relate to the effect money has on how we behave. The first was a quote from a speech which Boris Johnson made to the City back in 2013 when he was still Mayor in which he said “I stress – I don’t believe that economic equality is possible; indeed some measure of inequality is essential for the spirit of envy and keeping up with the Joneses that is, like greed, a valuable spur to economic activity.”

The second  is a series of psychological studies demonstrating how thinking about or handling money increases people’s people’s motivation and problem solving persistence in ways that make them more successful but it also makes them less aware of and helpful towards others.

The results of nine experiments suggest that money brings about a self-sufficient orientation in which people prefer to be free of dependency and dependents. Relative to participants primed with neutral concepts, participants primed with money concepts preferred to play alone, work alone, and put more physical distance between themselves and a new acquaintance. In one experiment, a pedestrian close to a cash machine dropped a bus pass. Passersby who had just taken cash from the machine were less likely to stop and help the person than people who had not used the cash machine.

More startling is the discovery that the effect of handling money holds for children as young as 3 years old.  In one experiment, young children were instructed to sort money by denomination, while others sorted buttons by color. They were then given a maze to solve and were told they could quit at any time. Money sorters worked longer and were more successful at solving the maze than button sorters. In another experiment, 3 year-olds sorted either coins and banknotes, or buttons and paper slips before being asked for their help tidying up materials ready for the next child to take part.  Money sorters were less helpful than button and paper sorters.

So, Boris, you might indeed be right that money (or the desire for money)  motivates activity which leads to further financial reward but, if it simultaneously makes the people dealing with money ever more self-sufficient and less aware of or willing to help others, then maybe no wonder we end up with the level of inequality we have in the world today.

Posted in Psychology | Tagged , , , , | Leave a comment