
“‘Tis the year’s midnight, and it is the day’s,
Lucy’s, who scarce seven hours herself unmasks;
The sun is spent, and now his flasks
Send forth light squibs, no constant rays;”
So, how has Bert, our Wattstor solar battery, fared in this darkest month of the year?
The chart below shows the daily Wh averages for each of the 8 months we’ve had the system. It shows our daily demand, the solar PV input, the amount we’ve had to import from the grid and the amount we’ve exported to the grid because it’s more than the battery can absorb at that point in time.
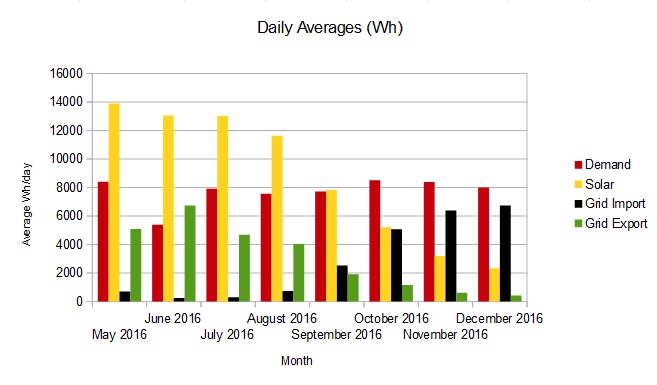 Our demand stayed fairly level at around 8kWh per day. The solar dropped to an average of 2.3 kWh a day and it rarely got a chance to generate a surplus (over the amount the house was using) in order to top up Bert-the-battery. It still managed to export an average of 408 Wh/day to the grid when we would (selfishly) rather have that stored in the battery for our own use! Still, at least it’s public spirited and we are being paid for everything we generate.
The 2nd chart shows the proportion of the electricity we have used each month which is provided by each source – either directly from the solar panels or from solar stored in the battery or from the grid.
 Not surprisingly, 84% of the electricity we consumed in December came from the grid. We still got 8% from the solar panels directly and 7% solar via the battery.
It’s now January and already the sun is disappearing behind the hill a few minutes later each day so stay tuned for a bigger yellow and orange bar in January.
