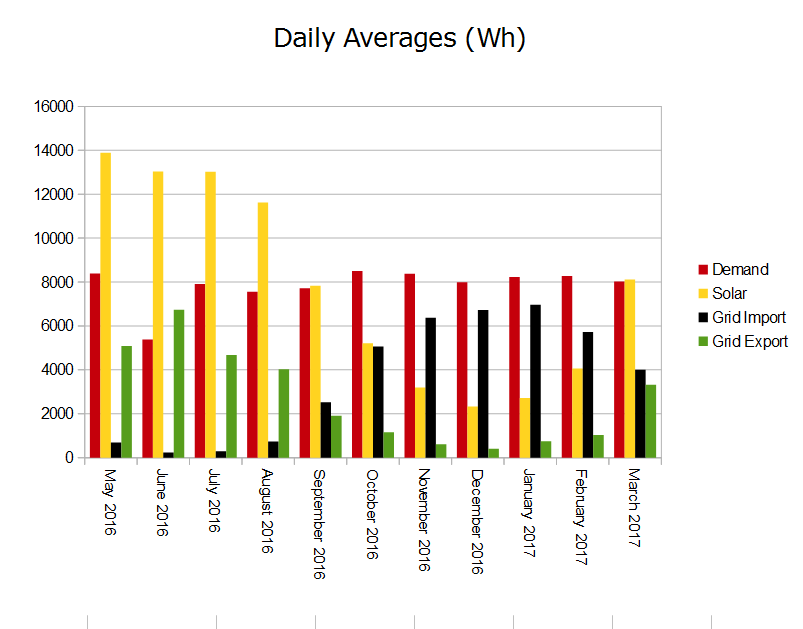
As the days get longer, our solar generation increases. March actually generated about the same as last September but the Wattstor battery control system is cautious about allowing the batteries to discharge beyond 70% or so until it’s confident there’s enough light hours in the day to fill them. Our lead acid batteries perform better and last longer if fully charged, but they won’t charge at high power for the last 15% or so of their capacity, so won’t reach 100% until the days are several hours longer. We think this explains why, despite there being as much solar generation in March as in September, this month saw both much higher grid export and import as the batteries were not maximising their storage capacity to the same extent.
We hope April 2017 will see our first 100% charge, possibly on the same day as we hear the first cuckoo.
As usual, the charts below show (i) our updated daily averages for our various power sources, and (ii) the percentage of our power usage coming directly from the sun, directly from the grid, or from the sun via the batteries.